Instructions
Left/Right - change real part of the parameter
Up/Down - change imaginary part of the parameter
X - redraw with new parameter
Z - show/hide the parameter
Explanation
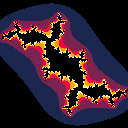
This is a visualisation of what is (wrongly*) called Julia sets after a French mathematician Gaston Julia who devised the formula governing them. They are drawn by assigning each pixel a complex value based on its coordinates and looking at a certain sequence based on that value. If the sequence shoots off to infinity in either direction the pixel is coloured based on how quickly it shoots off. If it stays bounded it is colored black.
The formula for the sequence is
f(0) = z f(n + 1) = f(n)^2 + c |
Where z is the pixel value and c is the parameter. My implementation looks at the first 20 values of the sequence and if the magnitude of one of them exceeds 2*sqrt(2) the corresponding pixel is coloured based on how fast that happened: sequences that grow slowly will be coloured bright and sequences that grow fast will be coloured dark. If a big enough value is not found in the first 20 values the sequence is considered convergent and the pixel is coloured black.
(*) The term Julia set actually refers just to points on the boundary of the black and coloured regions and are defined for many other functions than the one I'm using there.
[Please log in to post a comment]


