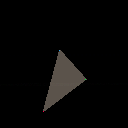
Press 'Z' for a New Triangle

There should be a simpler way to do this without scanning pixels on the screen.
Let me think ...
Here, try this:
See source to examine method I am using or
To load this cart in Pico-8 in immediate mode type,
load #tri
And I'm certain there's an even simpler way to do this, especially for those who have posted 3D games in the past.

Well, I get by with a little help from my friends. You know the tune ? :)
It is the truth, however. Years ago someone showed me how to draw a line from x1,y1 to x2,y2. And the code I wrote HERE:
https://www.lexaloffle.com/bbs/?pid=116827#p
Makes use of that.
So I gave it some thought and wondered what would happen if I drew a line for all the vertices from x2,y2 to x3,y3 using a ramp of x1,y1 ?
And it works ! Well, sorta ... It leaves little holes if the thickness of the line drawn is just 1 is why I overlap it with x+1 beside it.
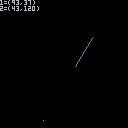
Here now, this is something we can all find useful. Fully documented code showing how to draw a line between two points both x1,y1 and x2,y2.
Here is the source-code instead of loading it up if you choose.
-- simple draw line with dots
-- written by dw817 (10-27-22)

-- start a loop
repeat

-- clear screen
cls()

-- choose integer x1-coordinate
x1=rnd(128)\1

-- choose integer y1-coordinate
y1=rnd(116)\1+12

-- choose integer x2-coordinate
x2=rnd(128)\1

-- choose integer y2-coordinate
y2=rnd(116)\1+12

-- Show them as red and blue
-- dots
pset(x1,y1,8)
pset(x2,y2,12)

-- visually show the coords for
-- the starting point
?"1=("..x1..","..y1..")",0,0,6

-- visually show the coords for
-- the ending point
?"2=("..x2..","..y2..")"

-- get distance of x-points
distx=x1-x2

-- get distance of y-points
disty=y1-y2

-- get abs distance of x-points
absdistx=abs(distx)

-- get abs distance of y-points
absdisty=abs(disty)

-- pick the biggest absolute
-- distance of both
points=max(1,max(absdistx,absdisty))

-- calculate the slope for x
slopex=distx/points

-- calculate the slope for y
slopey=disty/points

-- set our plotter x to x1
drawx=x1

-- set our plotter y to y1
drawy=y1

-- loop to draw dots
for i=0,points do

-- draw dot only if it is not
-- the first one so our red
-- pixel will still appear
if i>0 then
  pset(drawx,drawy,13)
end

-- next point for drawx plot
  drawx=drawx-slopex

-- next point for drawy plot
  drawy=drawy-slopey

-- give a tiny pause to see
  flip()

-- end of our drawing loop
end

-- loop forever
until forever
|

Thank you, @PotatoImaginator. Yet I know there are some other Piconians that could run rings around both of us.
I wish they would appear and post some truly genius compact triangle-drawing sourcecode we could both understand and learn from.
Actually drawing a filled POLYGON would be even better.

I bookmarked https://www.lexaloffle.com/bbs/?tid=31478 a while back. Maybe it'll help.
I've never got round to drawing triangles in anger yet.
[Please log in to post a comment]


