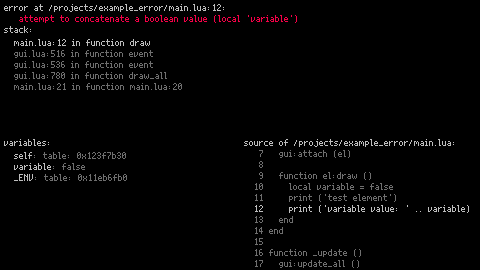
hi, i wrote an interactive error screen for picotron! on error, it lets you explore the stack, local variables, and shows the source location where the error occurred. use arrows to go up and down the stack, the mouse wheel to scroll, and click on table variables to expand them. you can also press space or x to toggle small-font mode.
download: https://github.com/snowkittykira/picotron-error-explorer
to use it, download error_explorer.lua and include it after defining your _init, _update and _draw functions.
it replaces these functions which wrappers that call them in a coroutine, so that when errors happen the coroutine can be inspected. on error, it does its best to reset the graphics state, but there might still be cases where this fails so let me know if you run into any issues!
it relies on the following functions from lua's debug library, so i hope they will continue to be available:
debug.tracebackdebug.getinfodebug.getlocaldebug.getupvalue
(note: please use the github version and not the one in the example cart, as it'll be more up to date)

THANK YOU!!
I was becoming insane trying to figure out what went wrong sometimes, considering I haven't found a convenient log function
Can I also use it to trigger a kind of debug error myself to inspect a specific location?

thanks~!
you should be able to call error("message") to trigger it wherever you want. also, if you run picotron from a command line, you can use printh("message") to log to the terminal (this is built in to picotron). error explorer dumps the error message / backtrace to printh as well in case that's helpful!

i just released version 0.0.6! changes:
version 0.0.6
- on error:
- show cursor
- make window resizable
- automatically adjust layout to window size
- support yielding (since fetch sometimes yields)
version 0.0.5
- future proofing: gracefully handle when
various parts of thedebugmodule aren't
available

Thank you, this script helped me so much with debugging errors
[Please log in to post a comment]


