


I've started up a new project and I'll be making extensive use of the trig-functions, so I started playing around with them. I soon found out about the input range and the inverted sin, but I still can not explain the behavior I'm seeing.
What you would expect from sin(x)cos(x) and what you can intuitively read from the graph is that first peak of sin(x)cos(x) should be negative, and the second positive. The actual behavior can be explained by the inverted sin-function, but with the inverted sin-function, I would expect the sin-graph to reflect the inversion, which it does not.
Code:
function _draw()
cls()
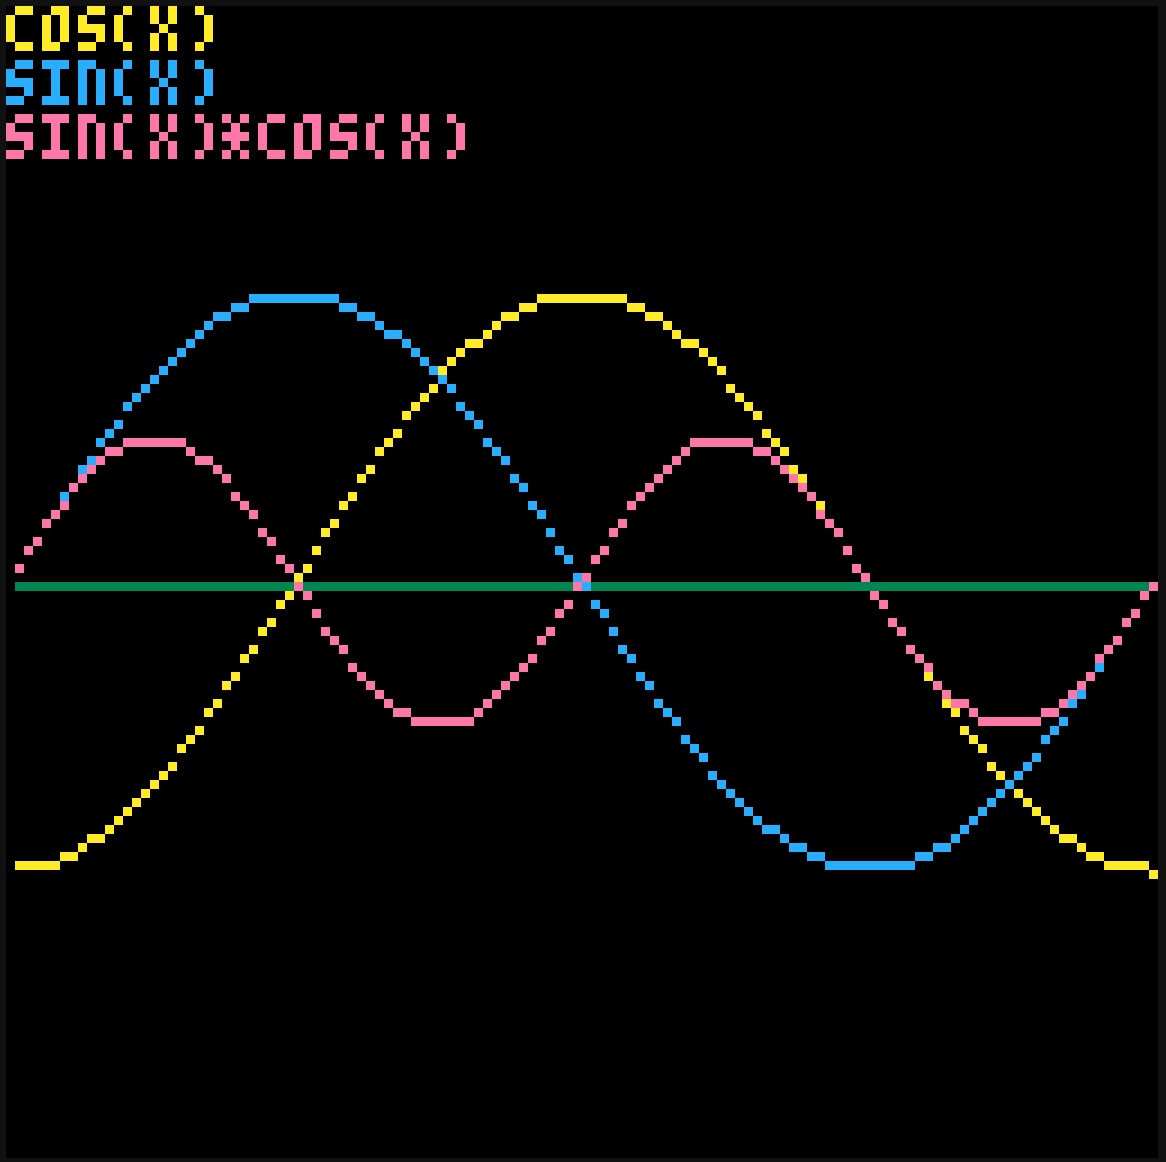
print("cos(x)",10)
print("sin(x)",12)
print("sin(x)*cos(x)",14)
for x=1, 127 do
pset(x, 64,3)
pset(x, 64+32*cos(x/127),10)
pset(x, 64+32*sin(x/127),12)
pset(x, 64+32*sin(x/127)*cos(x/127),14)
end
end |
(Sorry, I don't know how to format code on the BBS)

The same mistake I made yesterday. XD
(Use three backticks on the line before and after the code block to format it.)
[Please log in to post a comment]