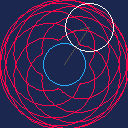
My submission for code guessing round #43. It's a visualisation of a spirograph with adjustable parameters:
- R1: radius of the blue, centered circle
- R2: radius of the white, rolling circle
- D: length of the drawing rod coming from the rolling circle
Controls
- Up/Down: select the parameter to adjust
- Left/Right: decrease or increase the parameter by 10 (or 1 if circle is held)
- X/M/Cross: flip sign of R2 (change between hypotrochoid and epitrochoid)
- Z/C/N/Circle: hold to change the parameter step from 10 to 1
About the implementation
Curve drawing stumped me for some time: they have infinite smoothness and calculating every pixel they go through sounds like an absolute pain and efficiency disaster. With parametric curves, like spiros and beziers, you can't even do that well, you can only make your parameter step as small as possible and hope it hits all the pixels. This is not a usable approach.
Then I realised: curves may be smooth, but PICO-8 display is not. I can approximate them with straight lines, which PICO-8 calculates for me! The only thing needed is a bunch of points on the line dense enough to create an illusion of smoothness, which PICO-8 doesn't require a lot of. In addition to that in most parametric curves go "slower" at sharp turns (have low derivative w.r.t. parameter) focusing the detail there, and approximating less curved sections with longer line segments.
You can see the function that calculates the points in tab 1 function curve(). It's calculated once every parameter change because it is a fair bit more resource intensive than just drawing it. i parameter indicates how far did the rolling circle roll around the centered circle, and based on that calculates angles and positions of the rolling circle and the drawing line, and the tip of the drawing rod is added to the list of points. Exactly the same approach is shown in the _draw function but split into steps: for a given t (how far the circle rolled) it calculates cx and cy (position of the rolling circle) and from that dx and dy (tip of the drawing rod).
Changelog

This is mesmerizing. Wish R1 could be either negative or blocked at 0 so the program wouldn't crash.varying D by steps of 1 makes for great animations most of the time. What might be fun would be to compute all the images that fit the screen or slightly more (not in pico of course), find a suitable starting point and for each new frame find the nearest (remove duplicates)not yet displayed image. After that, manually remove segments where things don't move enough, and save the frames coordinates(the R1,R2,D) sequence, and replay that in pico8 with music for a nice demo.If there's pico8 CPU left, an In/out flood fill of the curve might also look cool.

@RealShadowCaster I added a cap to R1 so that values 0 and lower aren't allowed. Flipping sign of R1 gives the same epi/hypotrohoid as flipping sign of R2 so it shouldn't block any possible shapes.
As for an animation: that would certainly look cool, but it's way above my skill level 😅 I don't even know how to approach estimating the distance between curves to make the animation smooth.

@olus2000 Thanks for the update.
When making demos, you often don't care how things work as long as it looks cool.
I remember pulling my hair trying to understand strange visual effect in a part of a CPC6128 demo, and after miserably failing the reverse engineering, I asked the author : it was calls in randomly generated addresses in the part of the memory that contained the drawing functions. He just tried different seeds until the demo looked cool and stopped crashing.
There's plenty of dark magic functions available for the image distance part
https://towardsdatascience.com/measuring-similarity-in-two-images-using-python-b72233eb53c6
From the most basic that counts the number of different pixels up to neural networks that no one understands, just pick the one that gives the coolest looking results.
[Please log in to post a comment]


