


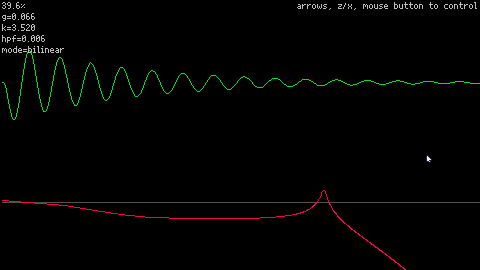
This is a tool for visualizing the impulse response (top) and frequency magnitude response (bottom) of different filters. The frequency magnitude response is determined by taking the magnitude of the FFT of the impulse response.
It's a pretty messy tool that's accumulated a few different features from various things I've been trying to do, but I want to refer to the cart in a Mastodon post so I'm posting it here. Ignore the blue and orange lines, those are from a different experiment; just focus on green and red.
Basic usage: left/right changes cutoff, up/down changes resonance, Z/X rotate through filter modes. There are some modes labeled "zep" that are more relevant to the Picotron filter. The ladder filters work fine at 0 resonance, the zep modes need at least a tiny bit of resonance to produce a signal (so you'll need to hit the up arrow a bit to get them to work).


Incredibly useful (and timely) tool -- thanks for posting!
I tried it out with some alternative knob->coefficient mappings, including the one below that just multiplies RES by LOW. It still has some cutoff drift when modifying RES, but I like the movement it gives for sweeps across LOW (click lmb and drag horizontally). I'm curious to see what kind of sounds I can get out of the svf version too.
> load #rlpf_test-0
I love the interface improvements! Definitely prefer the revised mapping to the current one.
[Please log in to post a comment]